
How NIU shot a whole catalogue without a studio and learned where Argentina plays
NIU is the official ball of the Argentine Padel Association, with forty years of manufacturing behind it and distributors from Capital Federal to Tierra del Fuego. What it did not have was a way to produce marketing imagery at the pace the catalogue demanded, or a data driven answer to where the next court was going to open.

The problem
A padel catalogue never stands still. Every season brings new rackets, new colourways, new ball formats, and each one needs images: on white for the marketplaces, in context for social, in print resolution for the distributors. Traditional photography could not keep that pace. A studio session takes weeks to organise, costs the same whether you shoot two products or twenty, and has to be repeated every time a colourway changes.
The second problem was geographic. NIU sells across the whole of Argentina, from Capital Federal to Tierra del Fuego, through a network of stores and independent distributors. But the decisions about where to push stock, where to sign a new distributor and how much to manufacture were being made on instinct and on last year's numbers, not on where padel was actually growing.
The approach
Four fronts. Build the entire marketing image library with AI so the catalogue can move at the speed of the product. Build a mathematical model of demand that combines NIU's own data with Argentina's national statistics, so production and distribution decisions rest on evidence. Map the distributor network against that demand to find where the brand is missing. And automate the operational work that was eating the week.
The entire marketing image library, generated with AI
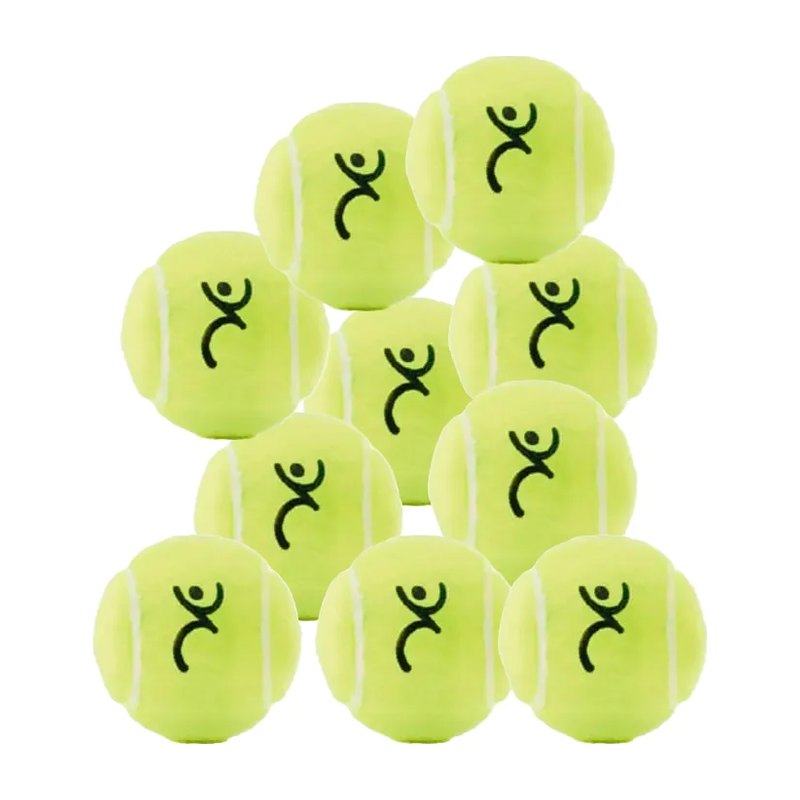
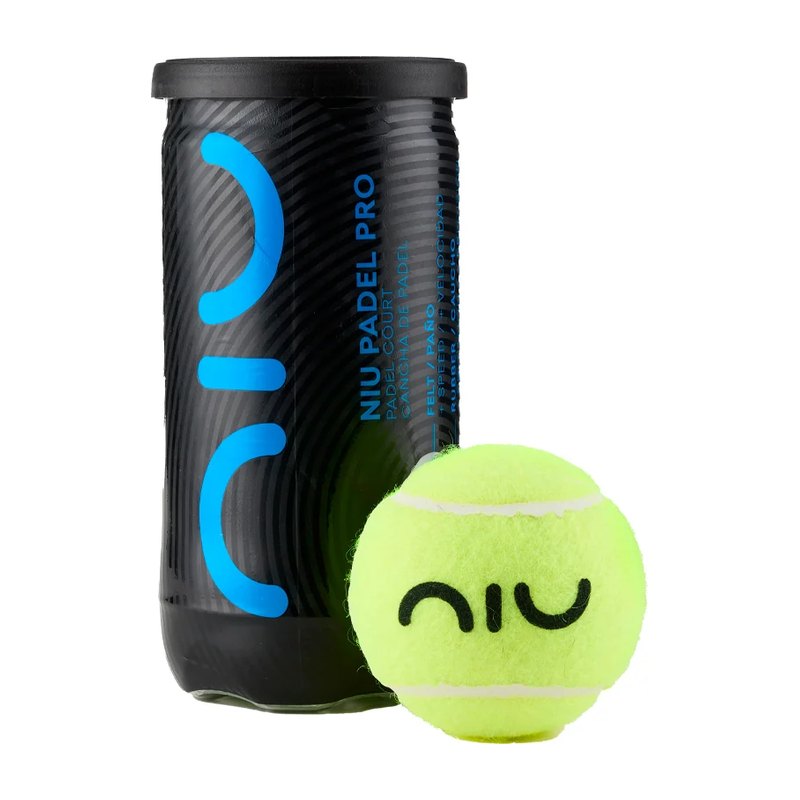
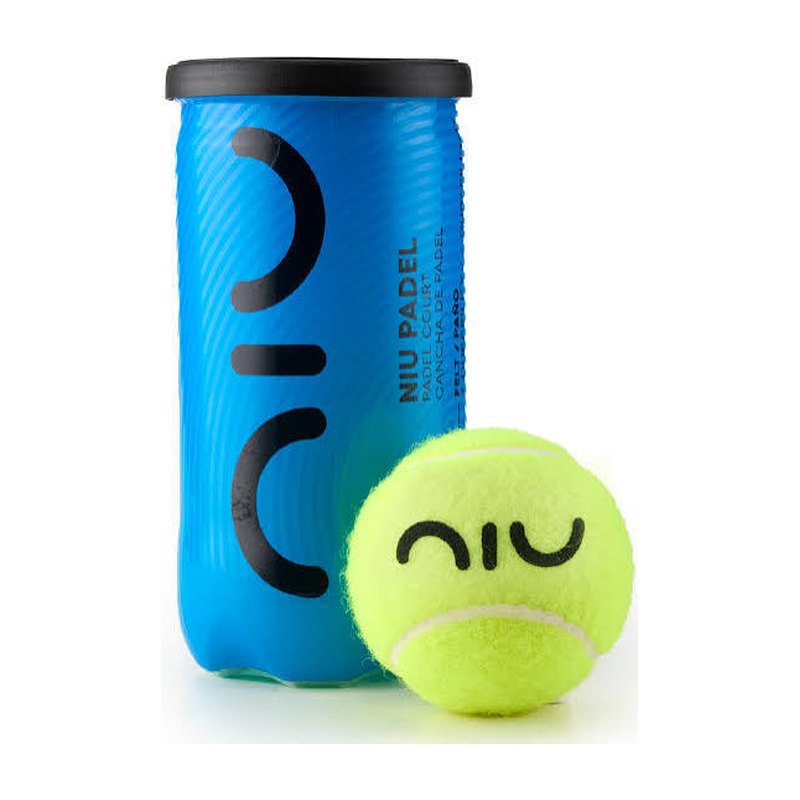
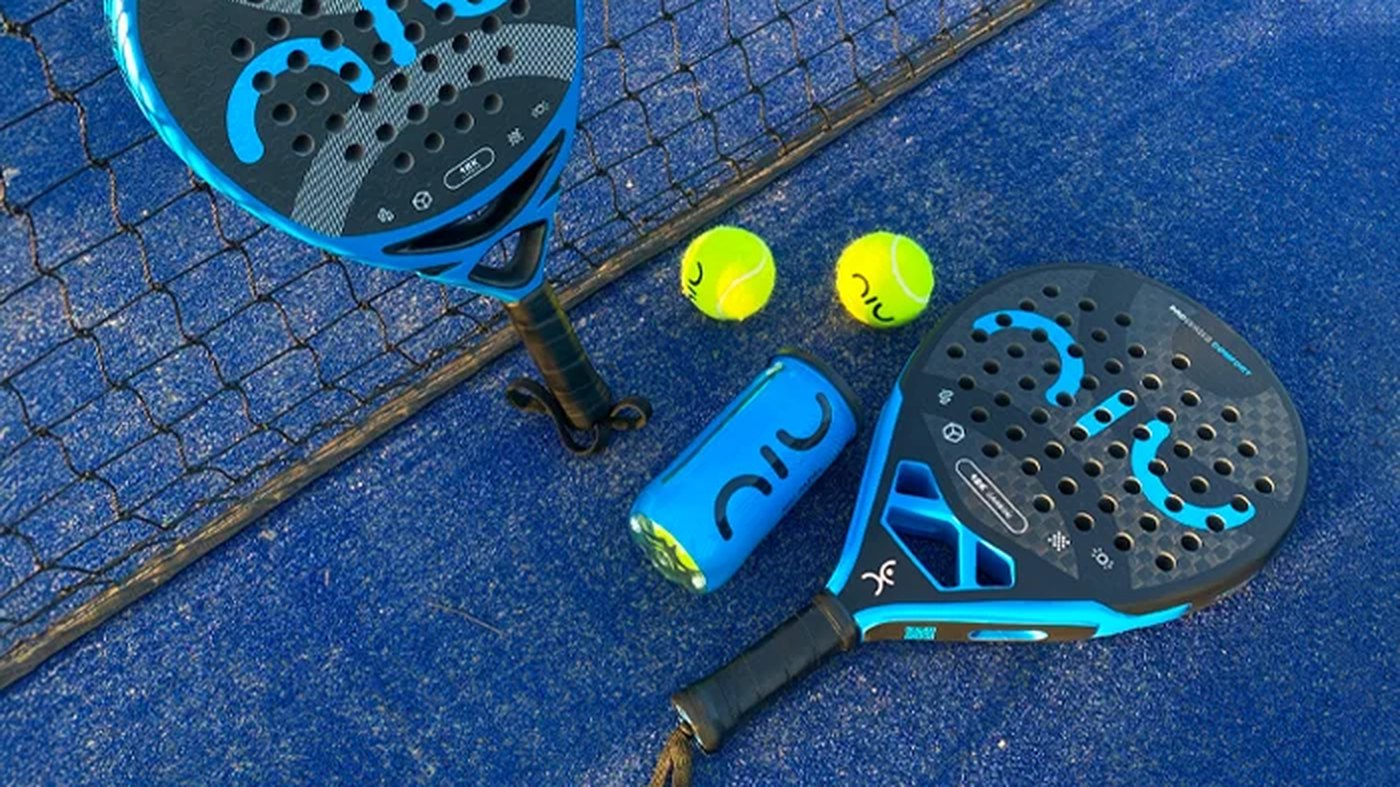
Every image on this page was generated with artificial intelligence. No studio, no photographer, no shipping samples across the country and waiting for the shots to come back. The products are real, the photographs are not, and the difference is invisible to the customer.
It is not one technique but several, chosen according to what each image has to do:
- Image to image from real references, so the geometry of a racket, the shape of a can and the position of every logo stay exactly true to the physical product rather than being reinvented.
- Text to image for context shots, placing the products on a real looking court, in the light and at the angle a photographer would have chosen.
- Inpainting for colourways, swapping a finish or a graphic on an approved base image, so a new model does not mean a new shoot.
- Reference conditioning for consistency, keeping lighting, shadow and framing identical across the whole range so the catalogue reads as one family.
- Upscaling and cleanup, taking each final image to print resolution with clean edges for the marketplaces and the distributor material.

A mathematical model of demand, built on NIU's data and the national census
NIU knows what it sold. What it did not know was why, or what comes next. So I built a model that puts the company's own history next to the country's own statistics and makes the relationship explicit.
On one side, everything NIU already had: sales by product and by year, distributor performance, seasonality, the difference between a ball that sells every month and a racket that sells at the start of a season. On the other, the public data that explains it: population and age structure by province and district from the Argentine census, urbanisation, income levels and how each of them has moved.
Put together, they answer the questions that actually decide a year: which provinces will grow and by how much, how many balls to manufacture for each season, which product line fits which region, and where the ceiling is in a zone that already looks saturated. The model produces a forecast by year rather than a single number, with its uncertainty stated honestly.
The distributor network, mapped against real demand
A distribution list is not a map. I plotted every point of sale, every independent distributor and every sale against where the model said the players actually were, and the gaps appeared immediately: zones with plenty of demand and nobody selling, and zones with three distributors competing over the same customers.
That turned expansion from a hunch into a queue. Instead of signing whoever got in touch, NIU could see which zone to enter next, what that zone was worth, and which existing distributors were underperforming against the demand sitting on their doorstep.
- Capital FederalWell covered
- Gran Buenos AiresWell covered
- Córdoba & Santa FeGrowing, room for more
- Cuyo & NorteUnderserved
- PatagoniaWhite space
The operational work, automated
The rest was the quiet work that never appears on anyone's job description and eats the week anyway. Catalogue data kept in sync across the website and the marketplaces. Distributor orders logged, confirmed and tracked without a chain of messages. Stock reconciled against what actually left the warehouse. Monthly reporting for each distributor produced automatically instead of assembled by hand.
None of it is glamorous, and that is the point. It runs now without anyone thinking about it.
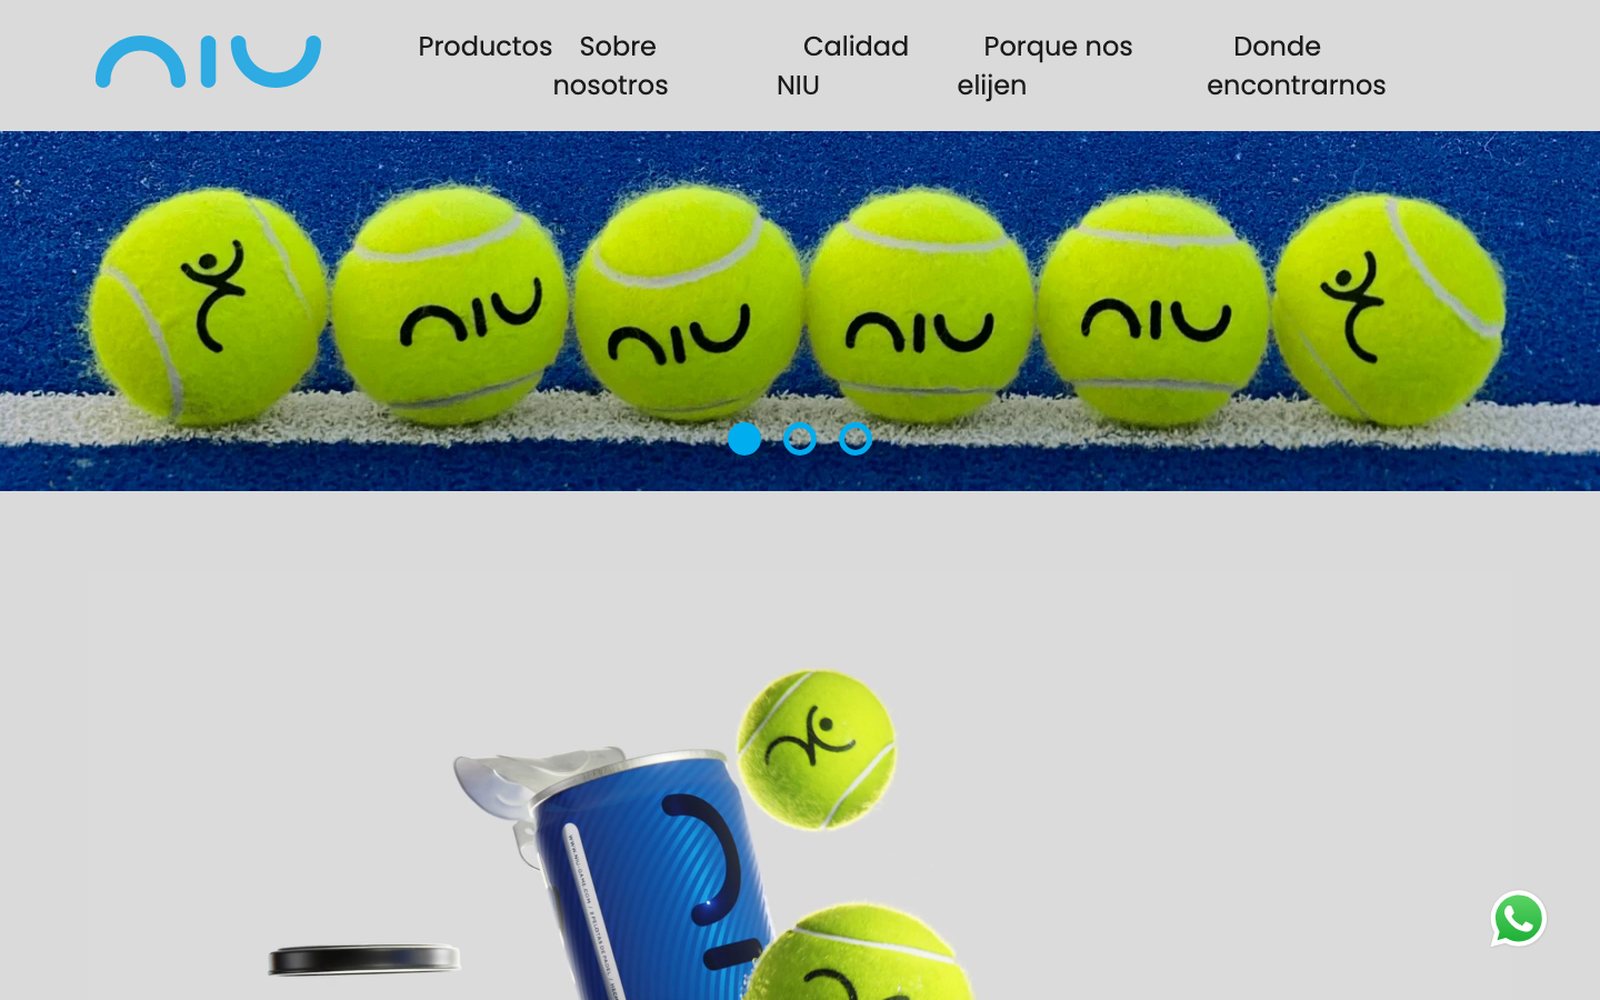
Click the preview to open niupadel.com.ar
Results
NIU can now put a new product in front of the market the week it exists, rather than the month the studio is free. It manufactures against a forecast instead of against last year, and it expands into the zones the data points at rather than the ones that happen to call. The brand did not get louder, it got better informed.
Want this for your brand?
Tell me what you're trying to figure out. The next case study could be yours.
Get in touch